
Bollinger Bands Strategy: Trading Volatility
Bollinger Bands are a dynamic channel indicator that combines price trends with volatility information. Using statistical principles, they show where price currently sits and whether market pressure may be building toward a breakout. Their core value is not a simplistic overbought-or-oversold reading. Instead, they help traders identify the recurring shift from volatility contraction to expansion and prepare for potentially large moves. In the highly volatile crypto market, understanding the squeeze-expansion-band-walk cycle is an important part of building a complete trading system.
What Are Bollinger Bands? A Channel That “Breathes”
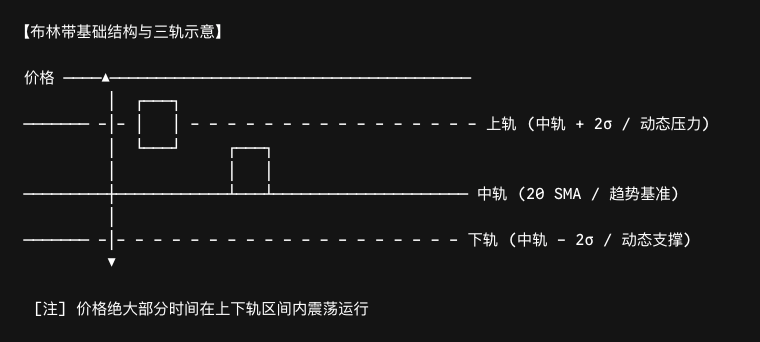
Bollinger Bands, often abbreviated as BOLL, were developed by financial analyst John Bollinger in the 1980s and remain among the world's most widely used technical indicators. Three lines form a dynamic channel that adjusts as price volatility changes:
- Middle band: Usually a 20-period simple moving average (SMA), representing the short-term trend baseline and a “value anchor.”
- Upper band: The middle band plus two standard deviations, representing dynamic resistance and a statistically extreme area.
- Lower band: The middle band minus two standard deviations, representing dynamic support.
In statistical theory, price has roughly a 95% probability of remaining between the upper and lower bands. However, financial assets such as cryptocurrencies often have “fat-tailed” return distributions. In practice, only about 85%–90% of observations may remain inside the bands. Extreme price movements therefore occur more frequently than the theoretical model suggests, which also makes Bollinger Bands especially relevant in crypto markets.
Core Method: Understanding Squeezes and Expansions
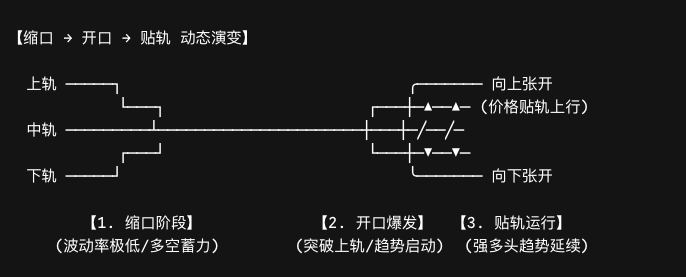
The most valuable use of Bollinger Bands is not simply locating support and resistance. It is monitoring changes in band width, which reflects volatility. Volatility tends to move in cycles, and periods of low volatility are often followed by sharp price movement. Understanding the squeeze→expansion→band-walk cycle is therefore fundamental to using the indicator.
Squeeze: The calm before the storm
When the market enters a consolidation range and buyers and sellers are evenly matched, the upper and lower bands gradually move closer together. This narrowing channel is called a squeeze and indicates that the market is storing energy. Data suggests that a major move follows a narrow channel in about 78% of cases. Rather than trading frequently during this phase, traders may add the asset to a watchlist and wait patiently for the market to choose a direction.
Expansion: The trend begins
When accumulated pressure is released, price breaks strongly through a band while the upper and lower bands spread sharply in opposite directions. This is an expansion. A genuine expansion has two conditions: price breaks through a band and band width expands at the same time. The appropriate response is generally to follow the trend rather than attempt to call a top or bottom against it.
Band walk: A sign that a strong trend is continuing
During a powerful trend, price may continue climbing along the upper band or falling along the lower band. This behavior reflects strong momentum. As long as price remains stable between the middle and upper bands, the bullish trend remains healthy.
The Most Dangerous Beginner Mistake
Many beginners assume that because price remains inside the channel about 95% of the time, they should short every touch of the upper band and buy every touch of the lower band. This approach works only in range-bound conditions while the bands are narrow. Once a trend begins and the bands expand, price may walk the band—continuing to rise along the upper band or fall along the lower band. When leverage is involved, trading against that trend can quickly cause substantial losses.
Bollinger Bands + RSI: Improving Signal Reliability
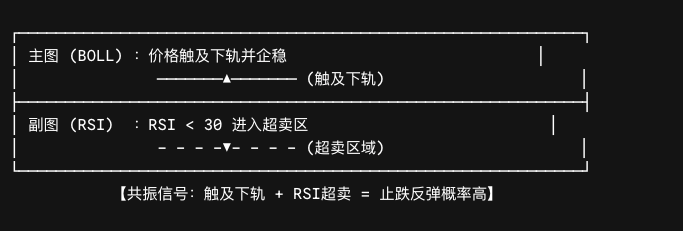
Bollinger Bands are useful for identifying changes in volatility and extreme price locations, but the indicator alone cannot reliably determine trend direction. Combining it with the Relative Strength Index (RSI) is a classic approach:
- When price touches the lower band and RSI is below 30, price is low within the channel and selling momentum may be fading, increasing the probability of a rebound.
- When price touches the upper band and RSI is above 70, upward momentum may be overstretched and traders should watch for a pullback.
- When price trades above the upper band while RSI remains above 70 without a divergence, the move may represent trend continuation rather than a reversal.
Note: A high %B reading, meaning price is near the upper band, does not automatically mean it is time to sell. During a strong trend, %B can remain high for an extended period. The measure is more useful when combined with trend, momentum, and volume indicators.
How to Use Bollinger Bands Across Timeframes
- Short-term or intraday trading: Use the 15-minute or 1-hour chart, confirm the broader direction on the 4-hour chart, and apply relatively tight take-profit and stop-loss levels.
- Swing trading: Focus on the 4-hour and daily charts. If the upper and lower bands expand at an angle greater than 45 degrees, the trend may be strong enough to justify holding the position longer.
- Medium- to long-term investing: Use weekly and monthly charts. Trade with the trend when all three bands point in the same direction; a band width move beyond historical extremes may coincide with a transition between bull and bear markets.
Main Limitations of Bollinger Bands
- No directional forecast: A squeeze suggests that volatility may soon increase, but it does not show whether the breakout will be upward or downward.
- Potential failure in strong trends: Price can walk a band for a long time, making conventional overbought and oversold signals unreliable.
- No volume component: A breakout supported by high volume is generally more reliable than one that occurs on weak volume.
Frequently Asked Questions (FAQ)
Q1: Why are the default Bollinger Bands parameters 20 and 2?
The 20-period SMA is a long-established balance between sensitivity and stability. Under a normal distribution, two standard deviations cover roughly 95% of price observations, making that distance a common threshold for identifying statistically extreme positions. However, John Bollinger also encourages traders to adjust the parameters to fit the characteristics of a market.
Q2: Does a move above the upper band always mean price will fall?
No. In a powerful trend, price can remain near the upper band for a long period and continue rising after breaking above it. The key is to distinguish an expansion breakout after a squeeze, which may signal the start of a trend, from an extremely overbought condition late in a trend, which may precede a reversal. The former favors following momentum, while the latter calls for caution.
Q3: After a squeeze, how can I tell whether price will break upward or downward?
A squeeze does not provide directional information by itself. Use other tools for confirmation: look for price to break the upper band on rising volume for an upward move or fall below the lower band for a downward move, and consult indicators such as RSI and MACD. If the bands expand at the same time as the breakout, the directional signal has stronger confirmation.
Related tutorials:
- Crypto Technical Analysis for Beginners: From Candlesticks to a Trading System
- How to Read Candlestick Charts: A Beginner's First Lesson
- Moving Averages Explained: Using MA and EMA to Identify Trends
- RSI Explained: A Practical Guide to Overbought and Oversold Signals
- MACD Explained: Trend Following and Divergence Signals
- Indicator Confluence Strategy: Trading with Multiple Confirmations
- Support and Resistance: How to Find Key Price Zones
Recommended reading:
Recommended
View more


Service@hotcoin.com
Product@hotcoin.com
Business@hotcoin.com
Casecn@hotcoin.com