
What Are MVRV, SOPR, and RHODL?
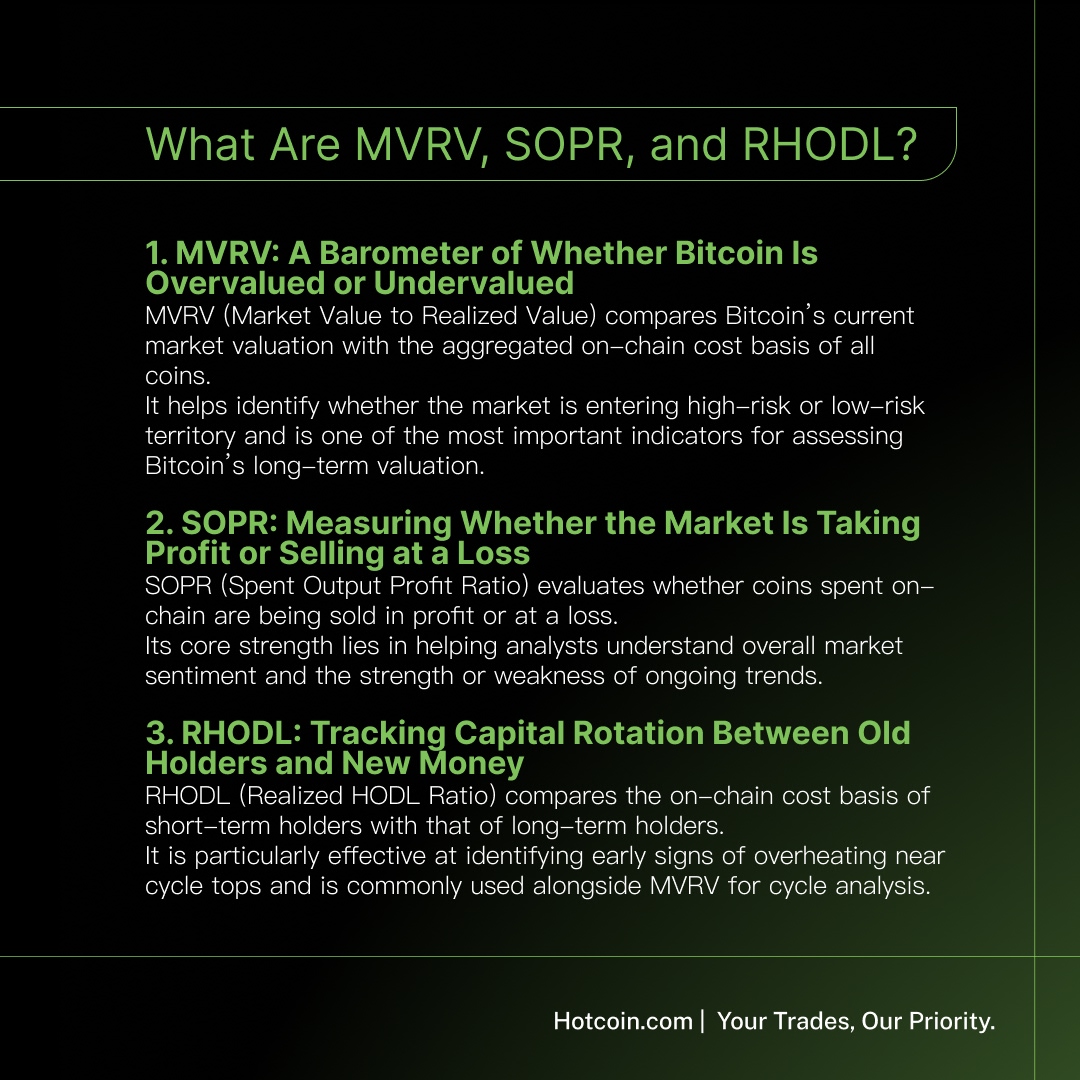
In the crypto market, on-chain data is considered one of the most reliable ways to understand real capital behavior and long-term market cycles. Among all on-chain metrics, MVRV, SOPR, and RHODL are three of the most widely used indicators among analysts, institutions, and long-term investors. They do not provide short-term trading signals; instead, they help determine whether the market is expensive or cheap, and whether investors are behaving with greed or fear.
1. MVRV: A Barometer of Market Expensiveness and Cheapness
MVRV (Market Value to Realized Value) compares the market value of Bitcoin with its realized value, which represents the aggregated on-chain cost basis of all coins.
-
Market Value is calculated using the current market price multiplied by the circulating supply.
-
Realized Value is calculated using each Bitcoin’s last on-chain moved price, revealing the actual cost basis of all holders.
In simple terms:
A higher MVRV suggests the market is becoming expensive.
A lower MVRV suggests the market is becoming cheap.
Typical interpretations:
-
MVRV below one: Deep undervaluation. Most holders are at a loss, fear dominates, and selling pressure weakens.
-
MVRV between two and three: Increasing risk and a likely overvaluation zone.
-
MVRV above three and a half: Extreme overvaluation and conditions often seen near cycle tops.
Because of this, MVRV is one of the most important tools for assessing Bitcoin’s long-term valuation and long-cycle risk levels.
2. SOPR: Understanding Whether the Market Is Taking Profit or Selling at a Loss
SOPR (Spent Output Profit Ratio) measures whether the coins being spent on-chain are being sold in profit or at a loss.
It evaluates the profitability of active transactions:
-
SOPR greater than one: Most on-chain transactions are taking profit. The market is generally optimistic and investors are realizing gains.
-
SOPR below one: Many investors are selling at a loss. This is often seen during the capitulation phases of bear markets.
-
SOPR around one: A break-even area that often acts as a transition point between bull and bear trends.
Practical applications:
-
In bull markets, SOPR repeatedly returning to the break-even line often marks a healthy “buy-the-dip” zone.
-
In bear markets, rallies often stall when SOPR approaches the break-even line, making it a “sell-the-rally” area.
SOPR is especially helpful for gauging market sentiment and evaluating whether market trends are strengthening or weakening.
3. RHODL: Tracking the Shift From Long-Term Holders to New Money
RHODL (Realized HODL Ratio) examines how capital rotates between short-term and long-term holders by comparing their on-chain cost bases.
Core insights:
-
Short-term holders, usually holding for one week to one month, tend to chase tops and panic-sell bottoms.
-
Long-term holders, holding for one year or more, typically accumulate heavily during market lows.
Interpretations:
-
High RHODL: A growing proportion of short-term holders. This often signals late-cycle euphoria and elevated risk of a cycle top.
-
Low RHODL: Long-term holders dominate supply, suggesting deep accumulation phases typical of bear-market bottoms.
RHODL is particularly effective for identifying early overheating signals and is often combined with MVRV for cycle analysis.
Conclusion
-
MVRV shows whether Bitcoin is expensive or cheap relative to its on-chain cost basis.
-
SOPR shows whether the market is taking profit or capitulating.
-
RHODL shows whether the market structure is dominated by long-term holders or fast-moving short-term capital.
Each metric highlights a different dimension of market behavior, but together they provide a comprehensive view of sentiment, holding structure, and cycle positioning. For long-term investors and researchers, combining these indicators can significantly improve their ability to identify market tops and bottoms—making them essential tools for navigating Bitcoin’s long-term cycles.
After Reading This Analysis, How to Seize 2025-2026 Cycle Opportunities?
The market is at a critical turning point. Whether you're dollar-cost averaging or swing trading, Hotcoin provides:
✓ Real-time price alerts for key support levels
✓ Professional charting tools for precise entry timing
✓ Low trading fees to minimize costs
Recommended
View more

Service@hotcoin.com
Product@hotcoin.com
Business@hotcoin.com
Casecn@hotcoin.com